Output Tables
Output tables are generated by system on running Network Optimization or Greenfield Analysis, these tables are:
Related to network optimization output:
Customer Flows
Interfacility Flows
Shipment Output
Production Output
Inventory Output
Facility Status
Network Flows
Related to Greenfield Analysis:
K-Means Cluster
Greenfield Locations
Others:
Grid Locations
Customer Flows Table
This table represents all the flows to customers and cost associated with it.
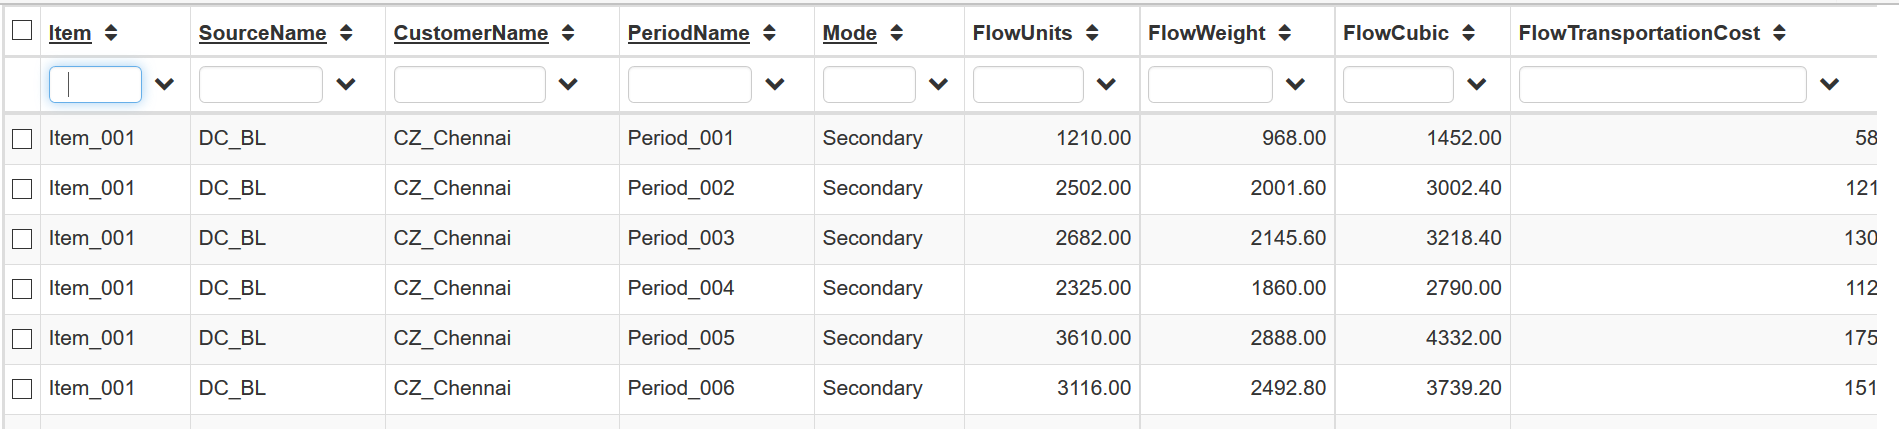
Item: Item as defined in Item table for which customer flow applies.
Source Name: Source facility from where customer is procuring.
Customer Name: Customer name/code as defined in location table.
Period Name: Period as defined in period table for which customer flow applies. For a single period model, “Default” will be stated.
Mode: Transportation mode for the specific customer flow.
Flow Units: Total flow in quantity as defined in demand table.
Flow Weight: Total flow in weight, derived from flow units and per unit weight as defined in item table.
Flow Weight: Total volumetric flow, derived from flow units and per unit volume as defined in item table.
Flow Transportation Cost: Average transportation cost of the flow as defined in Average Cost of Transportation Policies table.
Flow Duty Cost: Total duty cost of the flow as defined in Duty Cost of Transportation Policies table.
Flow Sourcing Cost: Total sourcing cost of the flow as defined in Sourcing Cost of Sourcing Policies Table.
Flow Distance: Distance between source location and customer, derived from Distance of Transportation Policies table.
Flow Total Cost: Flow Transportation Cost + Flow Duty Cost + Flow Sourcing Cost.
Interfacility Flows Table
This table represent all the interfacility flows in the optimized network.
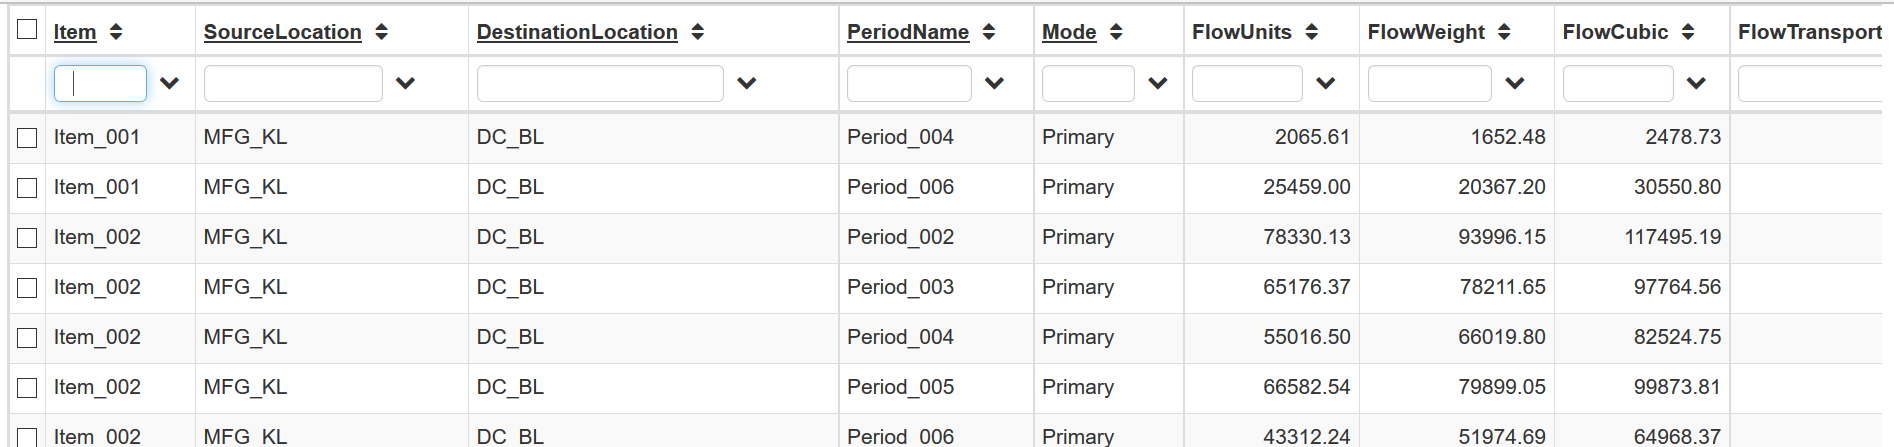
Item: Item as defined in Item table for which interfacility flow applies.
Source Location: Source facility of the interfacility flow.
Destination Location: Destination facility of the interfacility flow.
Period Name: Period as defined in period table for which interfacility flow applies. For a single period model, “Default” will be stated.
Mode: Transportation mode for the specific interfacility flow.
Flow Units: Total flow in quantity.
Flow Weight: Total flow in weight, derived from flow units and per unit weight as defined in item table.
Flow Weight: Total volumetric flow, derived from flow units and per unit volume as defined in item table.
Flow Transportation Cost: Average transportation cost of the flow as defined in Average Cost of Transportation Policies table.
Flow Duty Cost: Total duty cost of the flow as defined in Duty Cost of Transportation Policies table.
Flow Sourcing Cost: Total sourcing cost of the flow as defined in Sourcing Cost of Sourcing Policies Table.
Flow Distance: Distance between source location and customer, derived from Distance of Transportation Policies table.
Flow Total Cost: Flow Transportation Cost + Flow Duty Cost + Flow Sourcing Cost.
Shipment Output
This table represents all the primary and secondary shipments by mode, source, and destination location. It will show only those shipment for which Fixed Shipment Cost and Shipment Size are defined in Transportation Policies table.

Source Location: Source facility of the shipment.
Destination Location: Destination customer/facility of the shipment.
Period Name: Period as defined in period table for which shipment applies. For a single period model, “Default” will be stated.
Mode: Transportation mode of the shipment.
Total Shipments: Total shipments between source and destination location for specified period and mode. It is calculated based on Total Shipment Quantity and Shipment Size.
Total Shipment Cost: It is calculated using total shipments and fixed shipment cost.
Total Shipment Qty: Total flow requirements in quantity between source and destination location for specified period and mode.
Total Shipment Weight: Total flow requirements in weight between source and destination location for specified period and mode.
Total Shipment Volume: Total flow requirements in volume between source and destination location for specified period and mode.
Shipment Basis: Basis on which shipment size is calculated, it is derived from Shipment Size Basis from Transportation Policies table.
Production Output
This table gives production details of the optimized network
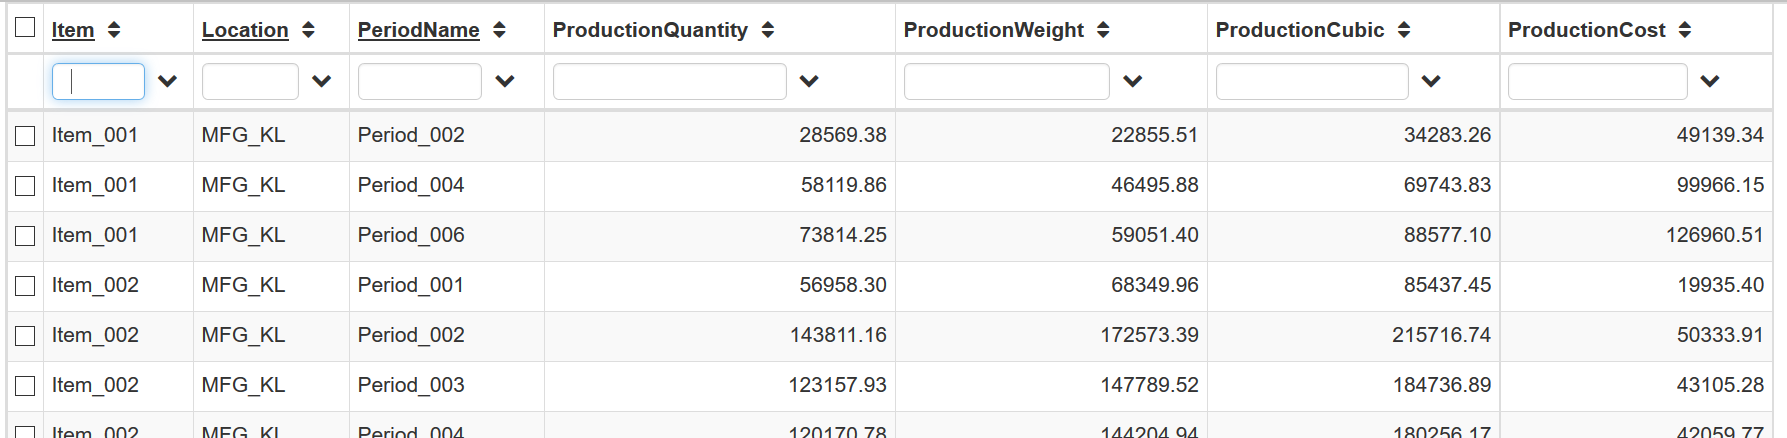
Item: Item for which records gives production details.
Location: Facility as which item is produced.
Period Name: Period for production record applies to. For a single period model, “Default” will be stated.
Production Quantity: Quantity produced for the specific item in specified facility in specified period.
Production Weight: Weight produced for the specific item in specified facility in specified period.
Production Volume: Volume produced for the specific item in specified facility in specified period.
Production Cost: Total production cost to produce specific item in specified facility in specified period. It is derived from Sourcing Cost of Sourcing Policies Table.
Inventory Output
This table gives inventories stored in a specific period and the different cost associated with it.
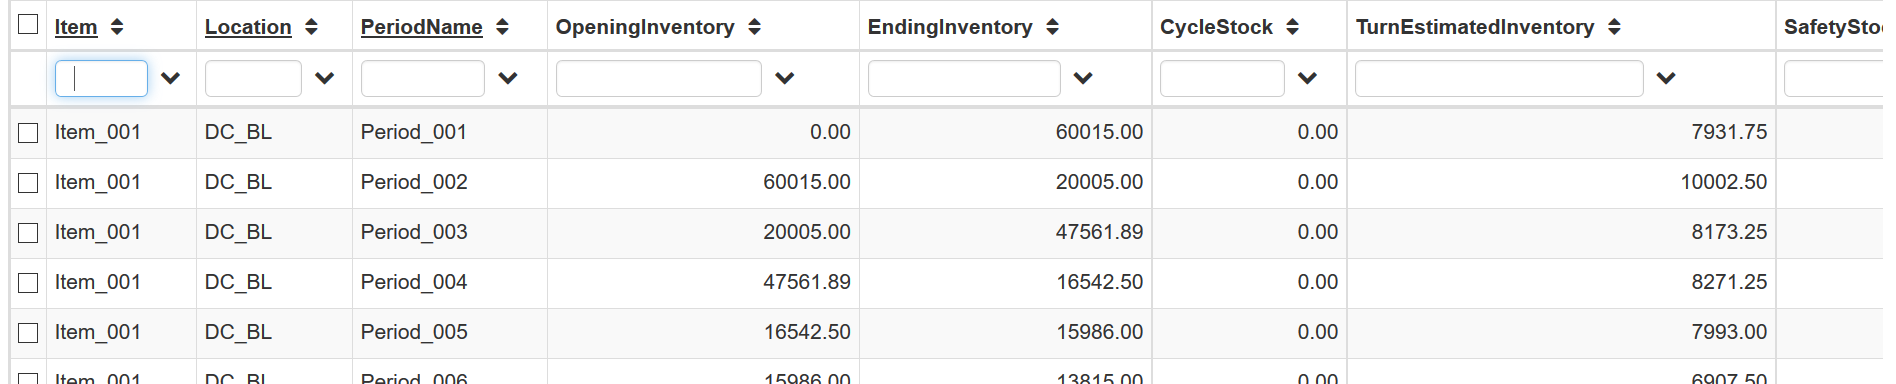
Item: Item for which record gives inventory details.
Location: Facility location for which record gives inventory details.
Period Name: Period in the which specified item is stored/moved at specified facility.
Opening Inventory: Inventory of the specified item in specified facility at the start of the period.
Ending Inventory: Inventory of the specified item in specified facility at the end of the period. Ending inventory of current period is equal to opening inventory of the next period.
Cycle Stock: It is working stock calculated based on Days Between Replenishment in Sourcing Policies table and Inbound Flow for the specified item in specified facility in specified period.
Turn Estimated Inventory: This is inventory required to hold as per Inventory Turns provided in Inventory Policies table.
Safety Stock: This is the safety required to keep as per Safety Stock in Inventory Policies table.
In-Transit Inventory: This is stock which is in-transit for the Lead Time specified in Sourcing Policies table.
Total Inventory: This is total average inventory for the specified item at specified facility in specified period. It is calculated as (Opening Inventory + Ending Inventory)/2 +Cycle Stock + Turn Estimated Inventory + In-Transit Inventory.
Total Flow In: This is total inbound flow for specified item in specified period to specified facility.
Total Flow Out: This is total outbound flow for specified item in specified period from specified facility.
Flow Outbound Warehousing Cost: This is total outbound handling cost as specified in Outbound cost in Inventory Policies table.
Flow Inbound Warehousing Cost: This is total inbound handling cost as specified in Inbound cost in Inventory Policies table.
Total Storage Cost: This is total storage cost based on Total Inventory of the record and Storage Cost in Inventory Policies table.
Total Holdling Cost: This is total holding cost based on Total Inventory, Item Value and Holding Cost.
Total Inventory Cost: This is calculated as Total Storage Cost + Total Holding Cost.
Facility Status
It shows close/open status for each facility and fixed opening cost ( if any ) associated with any facility.

Facility Name: Location code for the facility.
Status: Open/Closed, if the facility has no throughput, it is considered as closed.
Facility Fixed Opening Cost: Fixed opening cost of the facility as specified in Fixed Opening Cost in Location table.
Network Flow Table
It represent end to end flow for an item and a customer. To generate this table user needs to run “Generate Network Flows” from the RUN menu.

Destination Location: Customer location for which flow is given.
Item: Item for which flow is given.
Period Name: Period for which flow is given.
Mode: Transportation mode for the first leg of the flow, here first leg represents customer flows.
MFG Location: Facility at which item corresponding to flow is produced.
Source Location (n): Source Location for the nth leg of the flow.
Transportation Cost (n): It includes total transportation cost for nth leg, it is calculated as:
(Fixed Shipment Cost+ Average Transportation Cost + Duty Cost + Sourcing Cost)
Flow Handling Cost (n): It includes total handling cost for nth leg, it is calculated as:
(Flow Inbound Handling Cost for destination location + Flow Outbound Handling Cost for source location)
Inventory Cost: It includes total inventory cost for the flow, inventory cost is calculated based on flow units proportion and it includes storage cost and holding cost.
Production Cost: It includes production cost to produce specified item at specified manufacturing facility.
Facility Fixed Cost: If a facility has a fixed opening cost, it is split across all the customer-Item combinations based on their throughput in units.
Total Handling Cost: It includes total inbound handling cost for each leg and total outbound handling cost for each leg.
Primary Transportation Cost: It includes total transportation cost for all the legs except leg 1.
Secondary Transportation Cost: It includes total transportation cost for 1st leg.
Total Transportation Cost: It includes total transportation cost for all the legs.
K-Means Cluster
This table is generated by running Greenfield Analysis, it includes relation between customers and greenfield facilities.

K : It represent total number of greenfield locations, this number is same for each record.
Location : It represent customer location which is linked to greenfield facility.
Loc Latitude/Longitude : It represents customer location geo coordinates.
Total Demand: It represents total demand in weight/quantity/volume as set while running Greenfield Analysis for specified customer.
K Index: It represent ID of greenfield location.
K Name: It represents name of greenfield location.
K Latitude/Longitude: It represents greenfield location geo coordinates.
K Distance: It represents distance between specified greenfield and customer location.
K Nearest: It represent nearest customer location to the specified greenfield location.
Facility Type: Fixed/Variable, user may choose existing facility in Greenfield Analysis, if greenfield facility is existing one, it is referred as Fixed else Variable.
Greenfield Locations
This table gives list of greenfield locations with its geo coordinates and address details.

Name: Greenfield facility name.
Loc Latitude/Longitude: It represents greenfield location geo coordinates.
Total Demand: It represents total demand in weight/quantity/volume as set while running Greenfield Analysis from specified facility.
ZIP/City/Country/State: These fields are populated by system using reverse geocoding API. It may happen that system fails to reverse geocode some locations, in that case NA is populated.
Grid Location
This table gives list of all the locations generated by grid with its coordinates and reverse geocode addresses.

Latitude/Longitude: Geo coordinates of the grid location.
Address: Reverse geocoded address for all the grid locations.