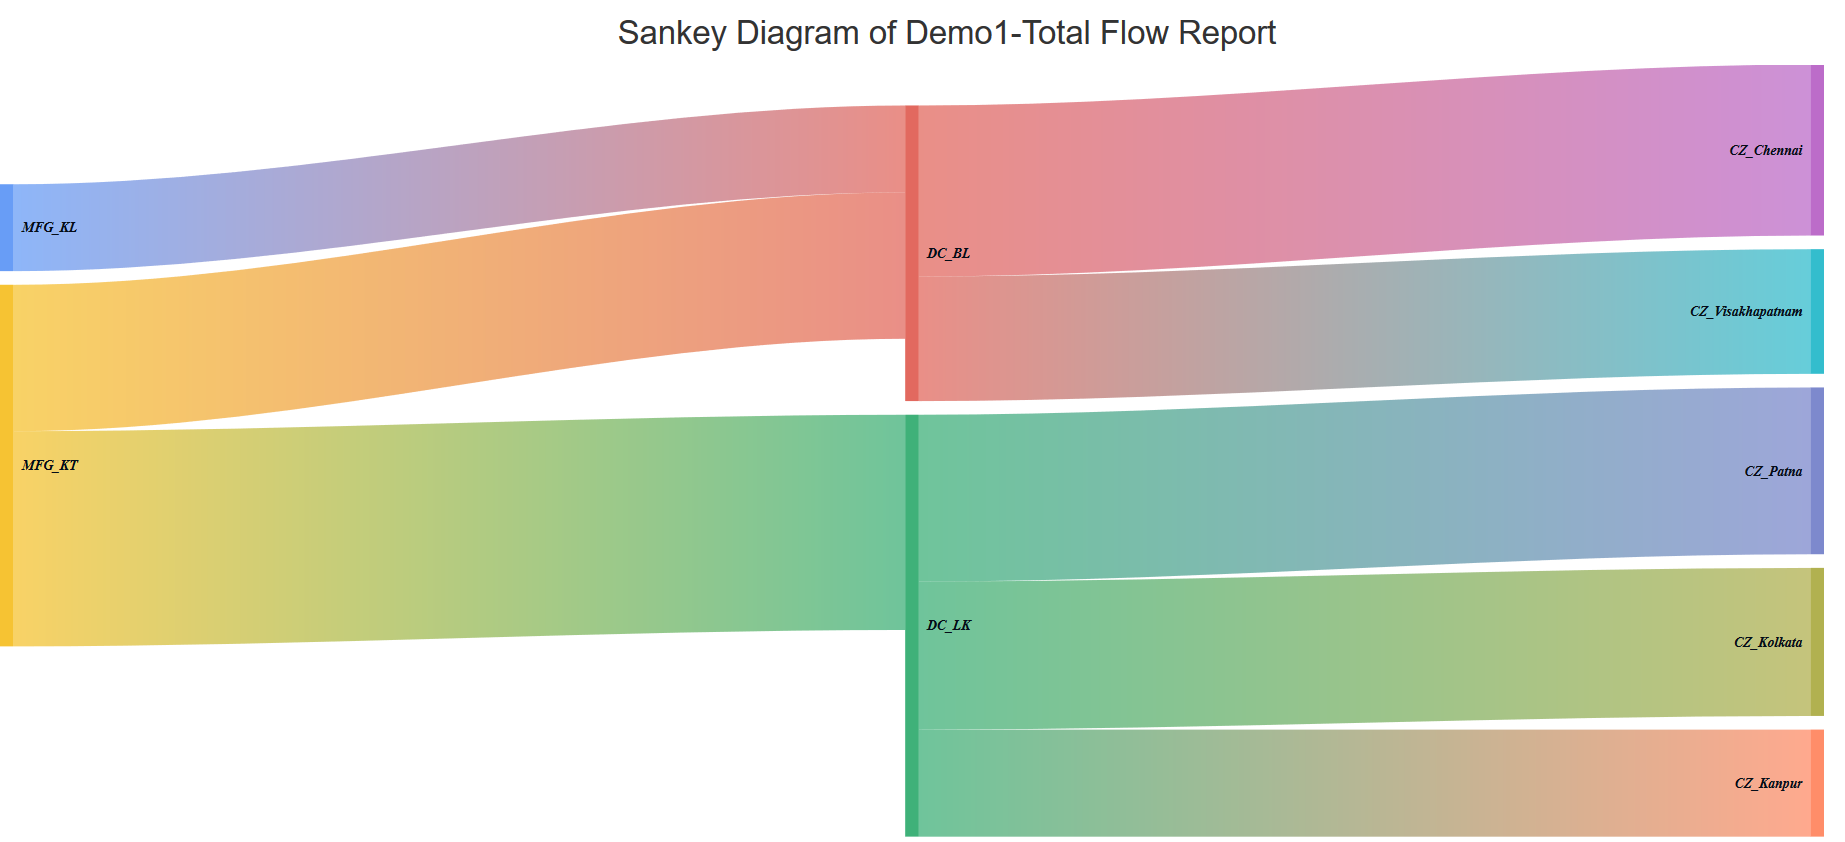
Sankey Diagram
DISPLAY
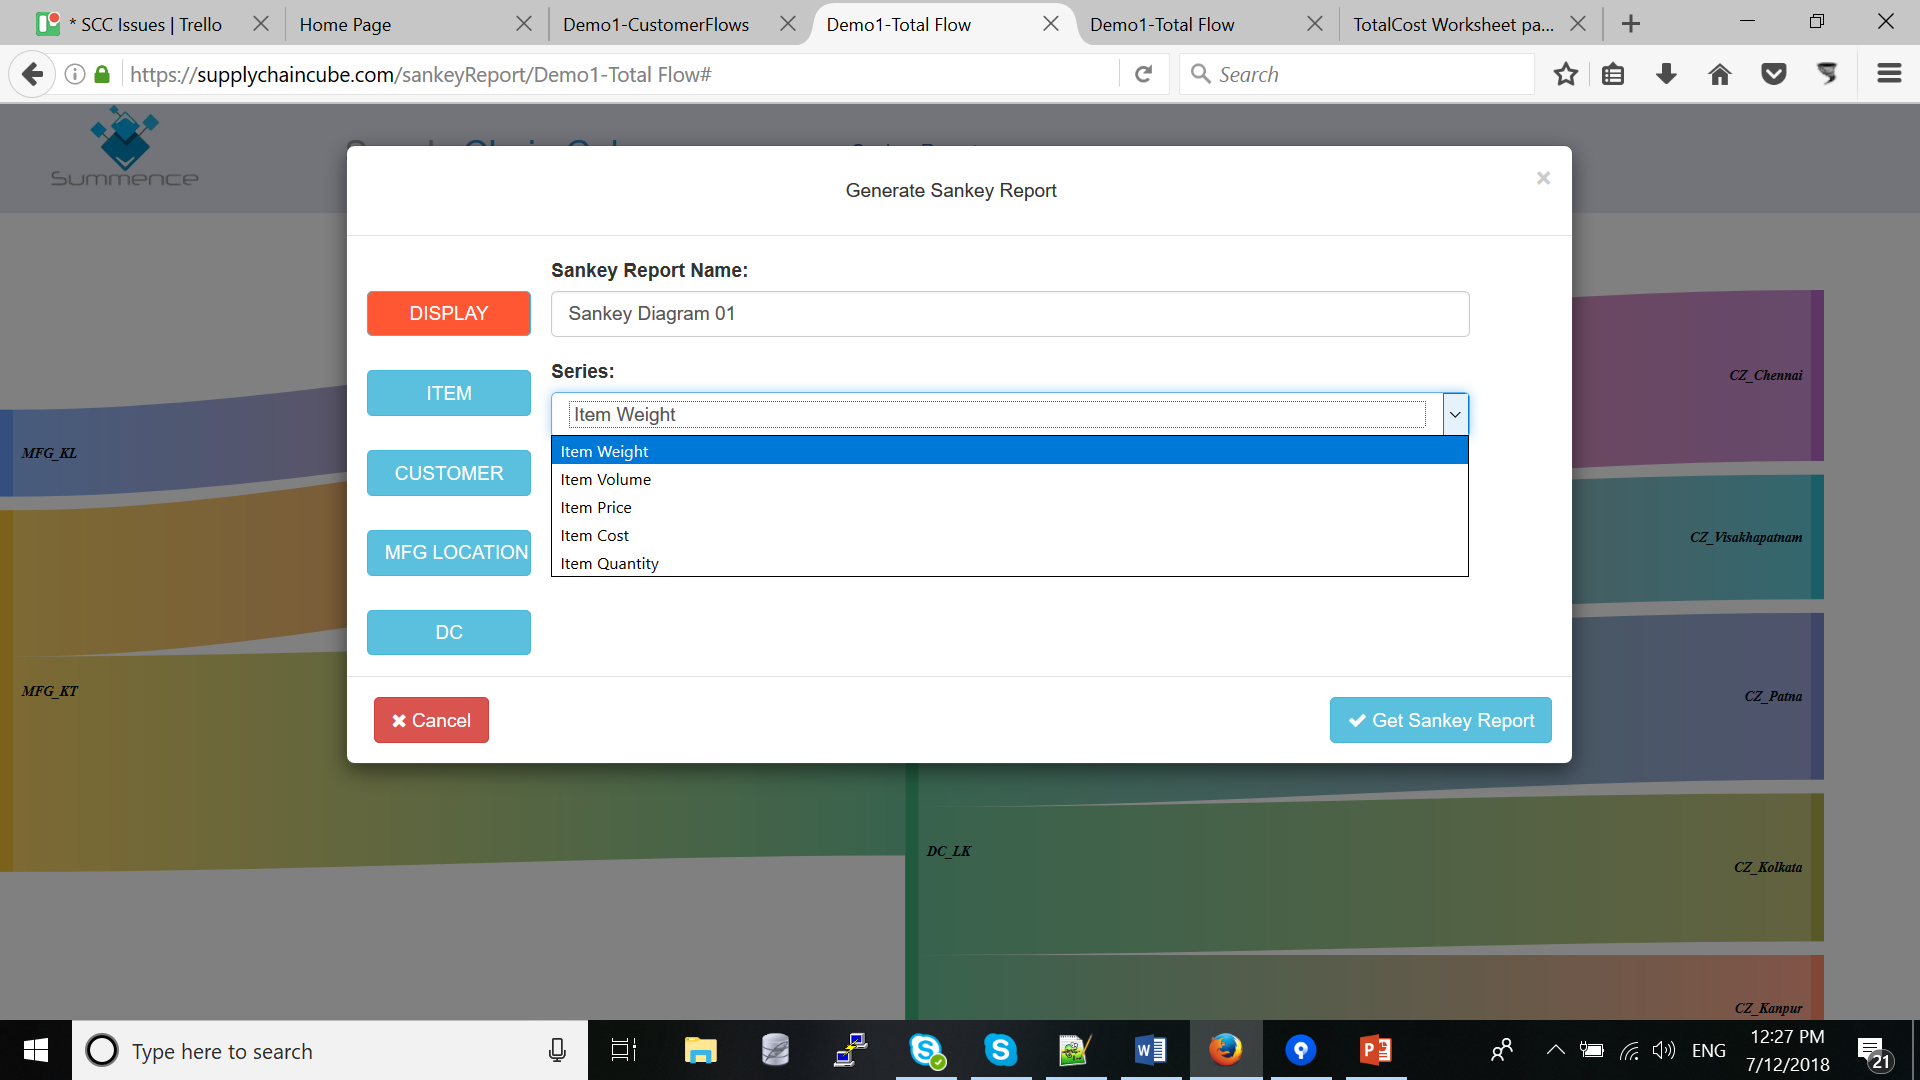
Sankey Report Name: User needs to provide a unique name for each Sankey diagram.
Series: User needs to choose series which will represent flow for Sankey diagram, user may aggregate flow by weight/volume/quantity/value/revenue.
ITEM
User may filter items for which it needs to see flow in Sankey diagram.
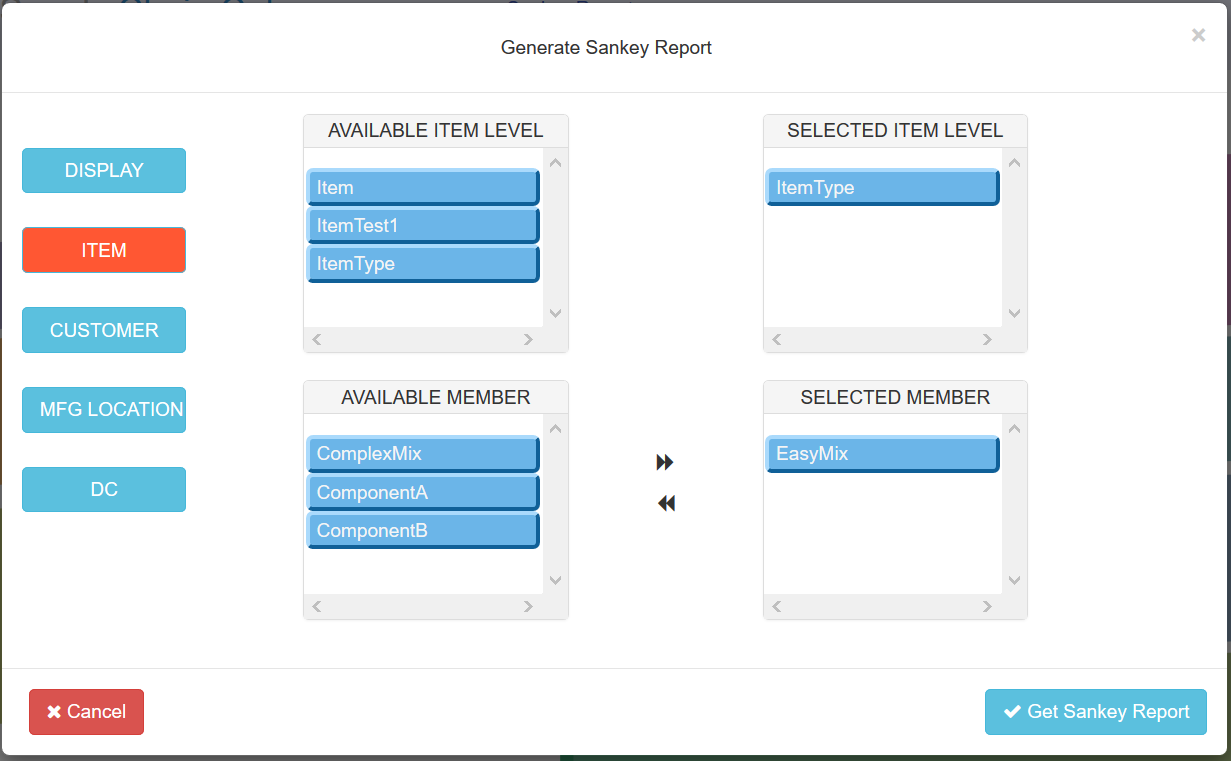
Available Item Level: It shows “Item” column and all user defined column in “Item” table, user may double click on any member in this pane to move members to Selected Item Level pane.
Selected Item Level: It shows the column names on which user wants to filter. To add a column in Selected Item level, user needs to double click that column in Available Item Level pane.
Available Member: It will all the unique members available in last member of Selected Item Level pane.
Selected Member: User may add members on which to filter item based on Available Members pane by double clicking required members.
CUSTOMER
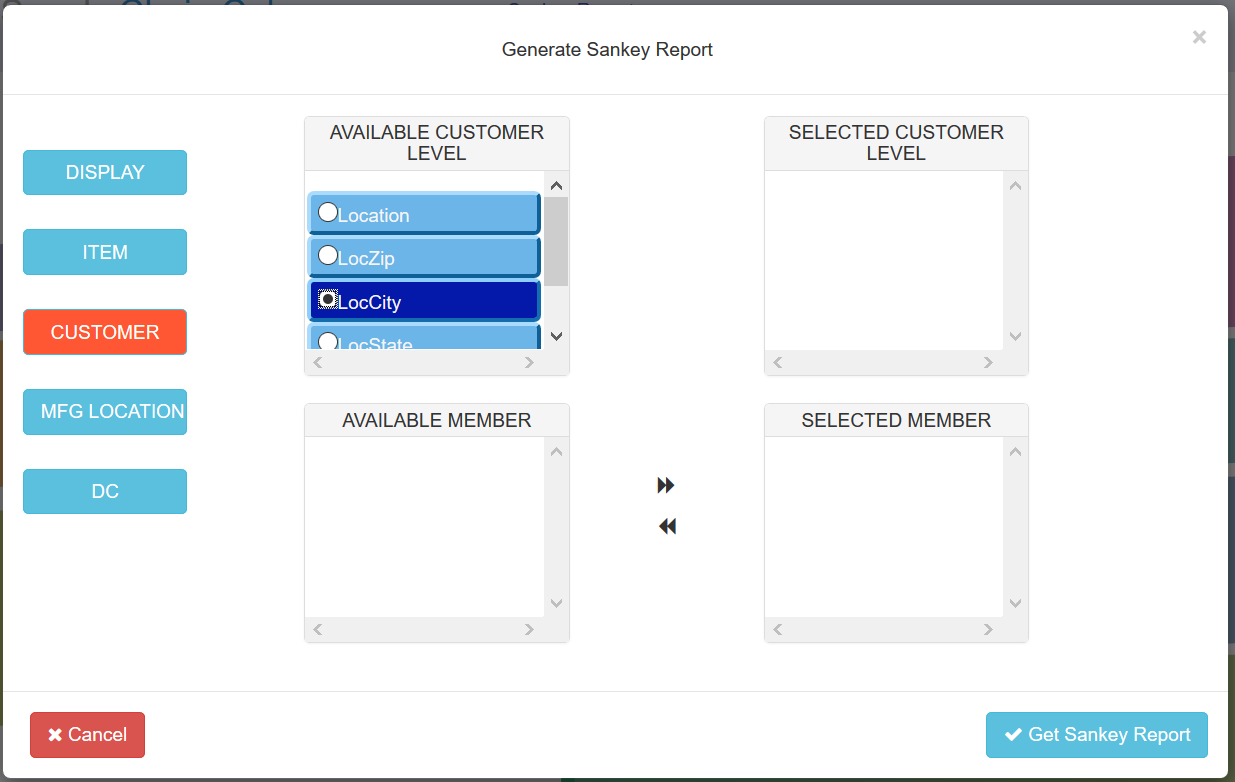
Available Customer Level: It shows “Location”, “Zip”, “City”, “State”, “Country” column and all user defined column in “Location” table, user may double click on any member in this pane to move members to Selected Customer Level pane.
Selected Customer Level: It shows the column names on which user wants to filter. To add a column in Selected Customer level, user needs to double click that column in Available Customer Level pane.
Available Member: It will all the unique members available in last member of Selected Customer Level pane.
Selected Member: User may add members on which to filter item based on Available Members pane by double clicking required members.
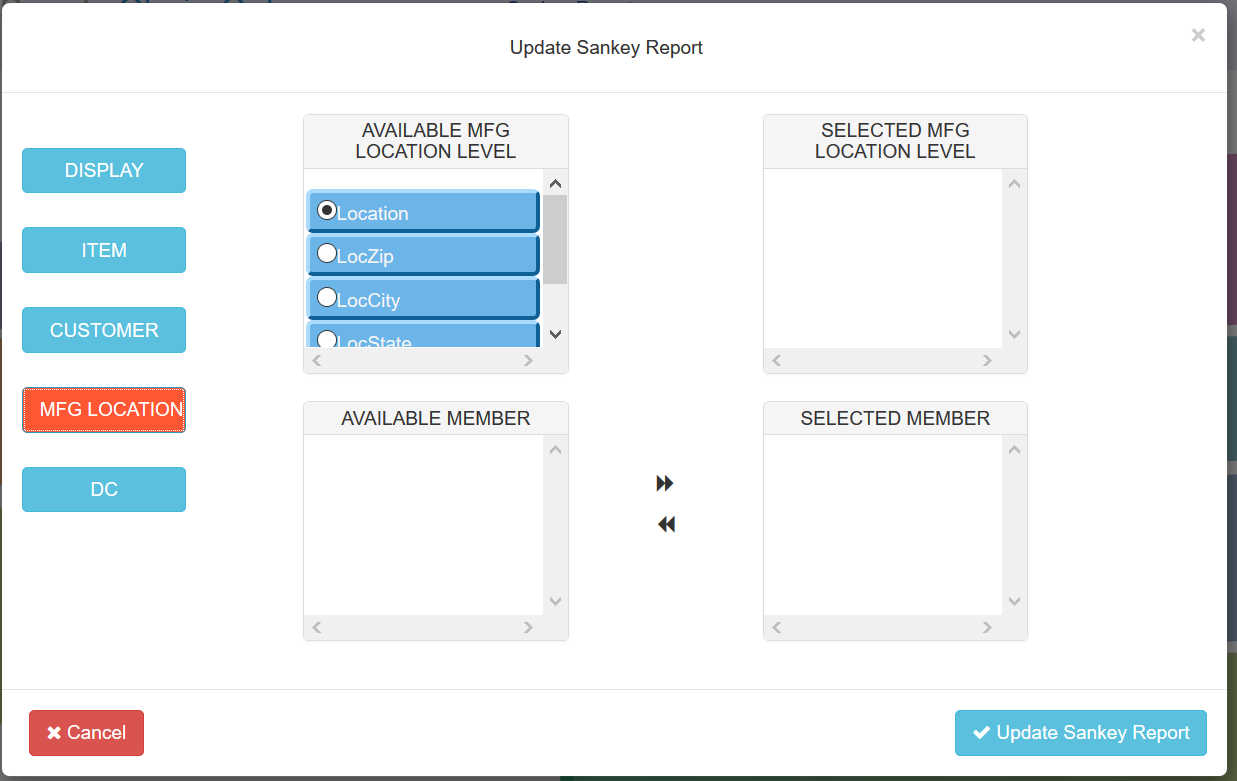
MFG LOCATION
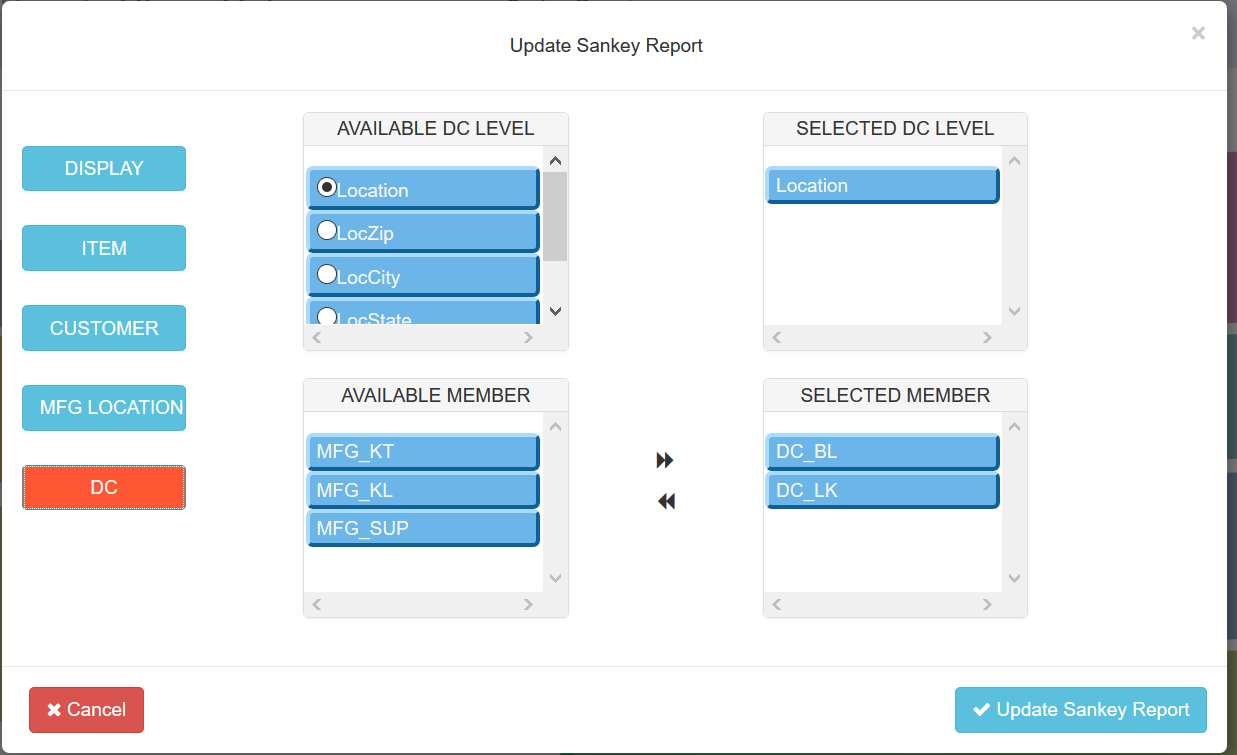
DC